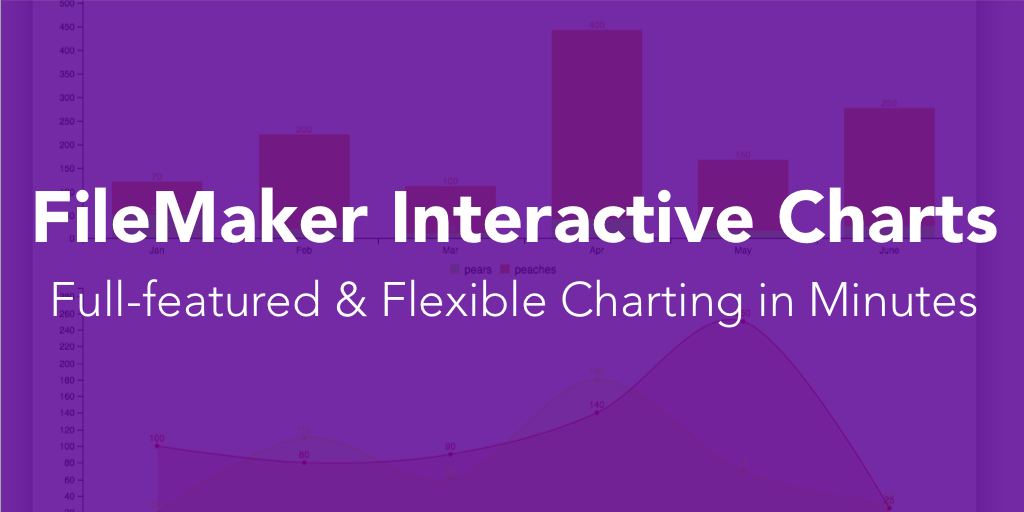
If you want rich interactive charts in your FileMaker app, you are going to need to go beyond the built-in FileMaker charts. Luckily, the FileMaker Workplace Innovation Platform has escape hatches you can use to get just about any job done. In this post and video, I am going to show you how to make FileMaker Interactive Charts with the maybe the most powerful escape hatch in the professional Filemaker developer’s toolkit, JavaScript!
Why Not Just Use the Built-In Charts?
The built-in charts that come with FileMaker out of the box are fine. They work well and look pretty good. But they are static. There is no animation and they don’t respond to clicks. There isn’t any way to drill down into data sets or otherwise explore the visualizations. Also, data visualization goes way beyond whats provided by the built-in charts. If we need that extra innovative experience in our apps then we reach for the JS.
FileMaker Interactive Charts
We’ll need some JavaScript and a charting library. We’ll use C3 for this demo. The C3 Charting library is a built on top of D3 the most popular data visualization JavaScript library on the planet. It provides a lot of functionality and a lot of customization possibilities. Take a look at this video to see how to set up the library in your custom app
Oh, and download the files here to follow along.
FileMaker C3Charting
The video is about 45 minutes long. Here’s a breakdown of the sections:
- 00:00–Setup
- 17:40–Customization
- 31:33–Handling Clicks
- 40:41–Dashboard Possibilities
Some notes
Completely customizable
FileMaker Interactive Charting gives us complete control of the chart. Here’s a partial list of elements we can control:
- The type of chart
- Displaying two types of charts in the same graph.
- The labels and their format
- The x-axis categories, their display format, and the number of ticks.
- The y-axis placement (left, right, or both)
- What happens when you click on or hover over a data point.
- The colors of each line or bar or pie segment
- Whether or not grid lines are drawn in the graph
It’s incredible what we can do, and it is fairly easy to set up.
Takes some time
FileMaker C3Charting does take some time to set up, but it gets easier the more times you do it. There’s the data structure and the library files code copying. You have to write in the customization you want and so on. There’s a lot to do, but that’s okay. It is worth the time to get the chart exactly how your client wishes it to be.

Dashboard possibilities
With a Web Viewer and with this charting library, you can set up a dashboard. More than one chart can be visible, each chart having different properties. With this library, a dashboard is easy to generate.
We will revisit this
FileMaker Interactive Charts requires a lot more discussion, so don’t think we are done with this discussion. In a future video, we’ll explore how to use JSON as the data that drives the chart.
Onward
The C3Charting JavaScript library is great Pro tool to add to our tool box when we need to go out that escape hatch and get the job done. In this case, we made some awesome FileMaker Interactive Charts. We’ll continue our study of JavaScript that we began at DevCon. Please join us in the SLACK channel, and we’ll talk about these. And stay tuned to our site for more integration videos.


Hi Jeremy, I have been implementing some of you C3 ideas into my app, thanks for the help. I noticed in your integration Examples file an implementation of Apex Charts, do you have a discussion of Apex charts somewhere? How does it compare to C3? Is one suggested over the other? Thanks Al
What is the Slack channel you mentioned I get a “This invite link is no longer active.”
I was just reviewing your presentation at a recent Meetup session where you spoke about using Javascript, is it possible to get a copy of the Pivot Table example you presented. Thanks
Thank you very much Jeremy for article!!! I applied JS charting into solution. It works nicely but I do experience problems to save chart as PDF. The axis are visible but graph itself is not. What is the reason of this problem? Is there any solution?